A SaaS Solution for the Evolving Needs of Marketers and Brand Strategists
Marketers and key decision-makers need to take advantage of AI-driven data that cuts through the noise of the ever-evolving social landscape and identifies trends and hit phenomena that traditional analytics miss. Graphika’s Contagion Monitor™ analytical tool is a software solution that helps strategists collect and analyze social media data and generate sophisticated analytics to detect business relevant trends, gain more insights on emergent campaigns, and deliver exponential value for their brand.
In this ever-changing environment, marketers, media and brand strategists struggle to rely only on traditional data analytics to evaluate brand success, make the best decisions possible, and unearth trends and opportunities they would otherwise miss.
One of the most elusive problems for marketers is predicting emerging trends and hit phenomena – from transformative content or campaigns to sourcing positive influencers to virally marketed products. When Harry Potter hit the shelves, nobody knew that the book would sell over 500 million copies, spawn a series of eight movies, and become a major cultural touchstone for an entire generation of children all over the world. When the iPhone launched, nobody knew that it would spawn a multi-billion dollar smartphone industry, much less that it would transform how we look up information, entertain ourselves, and stay in touch with our friends across the globe.
Graphika, the leading analysis engine for large scale, cybersocial networks, leverages the power of artificial intelligence to create innovative analytical methods and software tools to help marketers and key decision-makers to understand and navigate complex online networks. The Graphika platform provides easy access to unparalleled quantitative and qualitative insights in these networks, allowing marketers to track conversations around brands, discover positive trends and emerging influencers, and generate actionable marketing plans that enable growth.
The Contagion Monitor™ analytical tool is a powerful component to Graphika’s SaaS platform. The software identifies and analyzes internet data, including content, hashtags, and accounts propagating through the social network maps that are likely to quickly reach virality. The end result is an enhanced toolkit that makes it easier for marketers to extract maximum intelligence from network data and predict trends and insights leading to an optimized marketing plan with actionable results.
A Real-World Example: The Desus and Mero Story
The story of Desus Nice and The Kid Mero is a good example of how the Contagion Monitor™ software analyzed social media data to identify patterns to predict the virality of a couple of comedians from the Bronx now a cultural, late-night staple on Showtime.
Innovation at the Core
The reason Graphika got this one right is the power of social networks. The Contagion Monitor™ analytical tool doesn’t just look at the number of tweets or news articles about Desus and Mero. Through the software, internet data (e.g., content, hashtags, accounts) propagating through the social networks maps are identified and analyzed with a high degree of social reinforcement that are likely to quickly reach virality. Our analytical tool evaluated the relationships between people who talked about these DJs and determined that they are a well-connected community with broad outside reach.
In simple terms, we found that this community is closely engaged in conversations, supporting Desus and Mero’s content organically. These conversations didn’t get stuck in the community as if in an echo chamber. No, conversations about the DJs reached the broader public and ensured that their popularity spread far and wide beyond their most loyal fans.
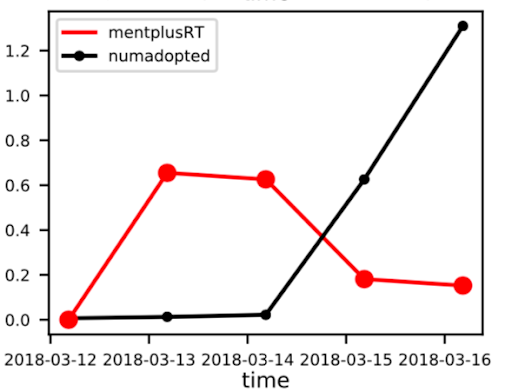
Fig. 1: Critical Mass Point of Engagements with Desus and Mero
The graph above shows two key data trendlines: in black, the number of people engaging with Desus and Mero; and in red, the density of network connections between these people. Density of connections is an important concept: it is the fraction of all possible connections between a group of people that actually exist. A high density indicates a very tightly connected community, a loyal fan base and a low density indicates a loosely connected community, such as the broader audience of people interested in an artist.
We can see something very interesting happening in the above graph. On March 13, 2018 and 14, 2018, the red line stands high, indicating a well-connected community engaging in conversation around the DJs. This is the community of their loyal fans. On March 15, 2018, however, the red line drops just as the black line rises. This means that the conversation moves from a tightly connected community to a loosely connected one just as engagement with the DJs rises. This transition means the conversation around Desus and Mero has achieved both initial high connectivity and broad outside reach. We call this transition point the critical mass point for viral engagement, and the graph above shows that Desus and Mero have successfully reached critical mass – a strong indication that their popularity is about to skyrocket.
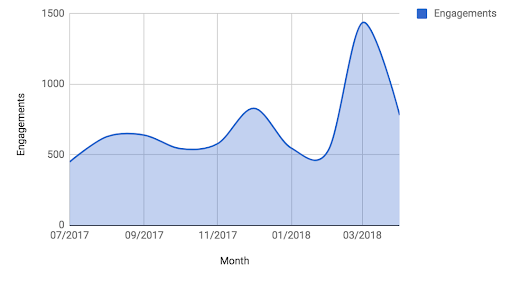
To confirm our analysis, we looked at how this short-term virality translated into medium-term and long-term trends. In the medium term, Figure 2 shows that engagement with Desus and Mero increased significantly in March 2018 (at the critical mass point) and stayed at 150% above their pre-critical mass level in April 2018. In the long term, we tracked the DJs’ popularity over 2018 to 2019. In that time period, they had a successful 5 borough tour, significantly grew their late-night TV audience, and secured a spot on the Showtime network. Their Twitter audience also grew from around 200,000 followers to over 1,000,000. We saw that viral engagements with the DJs translated not just into online buzz, but also into critical and commercial success. Desus and Mero are now major players in the American late-night scene.

Fig. 2: Engagements With Desus and Mero Over Time
We hope that this case study draws attention to the under-studied network dimension of popular success. Great artists create great art, but they also grow an audience that is ready to talk about their art with the world. Graphika’s Contagion Monitor™ analytical tool shows these two patterns go hand in hand. For marketers, it is critical to track both when identifying the next trend, influencer, or late night host!
(c) 2020 Graphika, Inc. All rights reserved.

