
On July 12th, 2019, Graphika Labs held its inaugural retreat in Boston, MA. We gathered to discuss our focus for the next twelve months and are excited to announce the five core pillars of Graphika’s research in 2019-2020:
- Deep Learning,
- Mapping Abstraction,
- Dynamics on Networks,
- Causal Inference,
- and Natural Language Processing.
These 5 pillars will keep Graphika’s technology on the cutting edge of research on network analysis. Our new research staff presented exciting results in each of these areas, and we’re pleased to share the highlights of the cool technologies coming soon from Graphika Labs!
Deep Learning
Our work on deep learning shows how we can use multiple sources of data—for example, both network and language data—to construct very large datasets and use those datasets to predict user behavior.
Analyzing large datasets in which many types of relations exist is complex and computationally expensive. However, machine learning approaches to social network analysis circumvent many of these issues via online learning. Moreover, many models retain graphs’ relational attributes (e.g., homophily, structural equivalence, edge context) and clustering propensity.
By integrating deep learning models for network and language data, we were able to determine the behavioral and language similarities between nearly 10 million author, submission, and subreddit nodes on Reddit and visualize major clusters in the network. We also predicted who interacted in a mental health community for suicide support using data from our similarity models with 90% accuracy and only 10% false-positives and false-negatives.
Our deep learning project showcases the importance of including behavioral as well as language data into models for classifying communities and predicting users’ membership and interaction patterns. We expect to integrate deep learning technology into many of our core products in the near future.
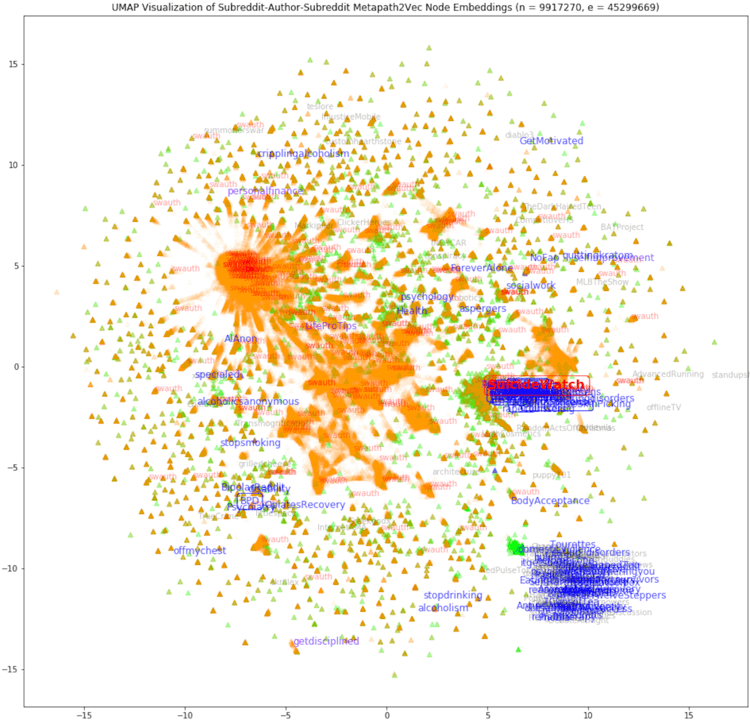
Visualization of network embedding positions for users and subreddits on Reddit
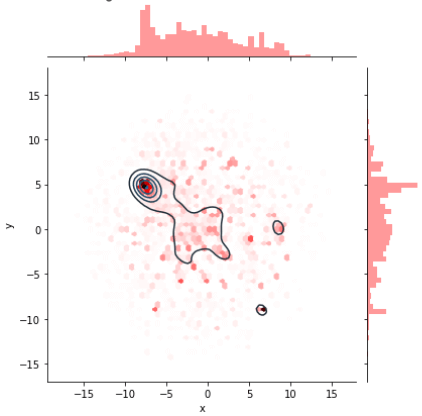
Heatmap of predictions for users who will post in a suicide support group.
Dynamics on Networks
Much of our work revolves around tracking content across a network. Our main product is a great example of this, and is one of many such tools we have developed at Graphika. At the retreat, we talked about some existing tools, like the Contagion Monitor™, and how to expand them, as well as new dynamical tools we could develop.
The Contagion Monitor™ is a powerful predictive product that leverages the concept of critical mass from social science. Critical mass says that if something spreads to a critical fraction of a networked population*, it will reach everyone in that network!
The Contagion Monitor picks out some interesting hashtags, user-mentions, and urls from our Twitter maps to find which ones are going viral. Every day it finds targets that spread virally over the previous five days, and this has been tremendously useful thus far.
A great example of the Contagion Monitor at work is when we pointed this tool at the South by Southwest (SXSW) music festival, and found two regional radio DJs (Desus and Mero) whose twitter-handles were going viral. These two DJs ended up going national, landing a hit series, and were an excellent find by the Contagion Monitor! You can see the full story of this discovery here.
At the retreat, we discussed how this groundbreaking tool could be made much more powerful if we can adapt it to find viral movements in hours or minutes rather than days.
The new version would send alerts for emerging events—breakout performances by the next hit artist. We also discussed offering additional information about the content that is going viral, such as:
- What topics are most of the tweets discussing when they use a hashtag or mention an account? (general topic analysis)
- What are the key causes of the content going viral? Did an influencer propel a hashtag to stardom, or was it something inherently viral about the hashtag itself?
- Is the viral content the result of an organic grassroots campaign or a coordinated effort to manipulate vitality?
We also plan to expand the Contagion Monitor to our maps on other platforms beyond Twitter, and expanding the content to include n-grams and more.
Other dynamics tools and methods we discussed include tracking ideological alignment and radicalization signatures in networks, tracking harassment between communities, and semantic analysis.
*There are some assumptions here about the network, that are meant to model typical social interactions.
Causal Inference
Causal inference is a powerful tool for answering the all-important “why” questions about networked systems: why did a particular marketing campaign succeed, while another failed? Why does one group of people believe disinformation, while another does not?
Causal inference requires us to engage with our assumptions about the causal mechanisms present in the world around us. It’s not enough to merely predict what is likely to occur, given some batch of data. Although prediction is useful for many cases, at Graphika we aim to understand the mechanisms at play within a given network—typically a social system—which requires an understanding of causation.
At the retreat, we discussed what it would look like to enrich our existing products with causal graphs. For example, by layering a causal graph on top of our existing Contagion Monitor, we hope to understand why certain hashtags go viral, and what are the best strategies for promoting a specific campaign’s virality. Picking the appropriate promotion strategy for a marketing campaign is one of the hardest (and most important) problems in the advertising space. Causal inference can help us solve this problem!
Until now, we have been largely exploring causal inference as part of the DARPA Ground Truth grant, which has provided an excellent opportunity to test out its techniques in simulations. After a year of initial testing, we are very pleased to share that we’re ready to try the tools developed as part of Ground Truth on real world case studies.
The implications of causal inference for marketing, influencer discovery, as well as disinformation analysis are incredible, and we are very excited to see what we can learn by applying causal techniques to Graphika data!
Natural Language Processing
Until now, Graphika has focused on a language-agnostic modeling approach, which is cool in its own way: we think it’s amazing to see how people are the same across languages. Looking ahead, we’d like to add ways for looking at what and how people say things, as well as to whom. To that end, we’ll be trying out some stylometric analysis, entrainment, and maybe hashtag phonology.
As always, once you start digging in to meaning, you need to take special care when moving between languages. Their glorious diversity makes them both awesome and tricky!
Stylometry means looking at the set of individual quirks in using the language that tell us, “yup, it’s [that person].” Many of these are unconscious behaviors, like the prevalence of prepositions (when’s the last time you counted yours?). Research suggests that even these unconscious behaviors reflect facts and truths about language users that we’re interested in knowing about.
From the technological side, the fact that we can look at “function words” like pronouns, instead of more open-ended categories of words (like nouns and verbs; “google,” being a great example of why that approach is difficult and getting harder every day) means that we can develop a proof-of-concept faster, and transfer it with less friction to a number of new languages.
Once we have some sense of how a person represents themselves through language, we want to see how that changes due to exposure to others—a process that linguists call “accommodation,” or “entrainment.” The way we change our patterns to accommodate or influence others shows a lot about how we perceive our relationship to them, in terms of power and persuasion.
We get one picture of power dynamics from the structured data of our networks: she has a lot of followers, so she’s very influential. Wouldn’t it be interesting to know if, when she engages with one particular kind of nobody, she’s the one being influenced?
A reach goal is to understand what makes certain hashtags more popular than others, when they’re all related to the same real-life event. For example, at the beginning of the spreading of awareness of the abduction of 276 Nigerian schoolgirls by Boko Haram, there were various competing hashtags floating around before #bringbackourgirls became the textual face of the movement. We believe it’s of critical importance to understand why that hashtag resonated, and not #nigerianschoolgirls or #bringourgirlsback? Perhaps the sound of the inner voice reading them has something to do with it, or some letter combinations are more pleasant to our eyes. We plan to find out.
Our mission at Graphika Labs is to explore, create and test new analytical methods and technologies to implement into Graphika tools to better serve our clients, partners and the world at large.