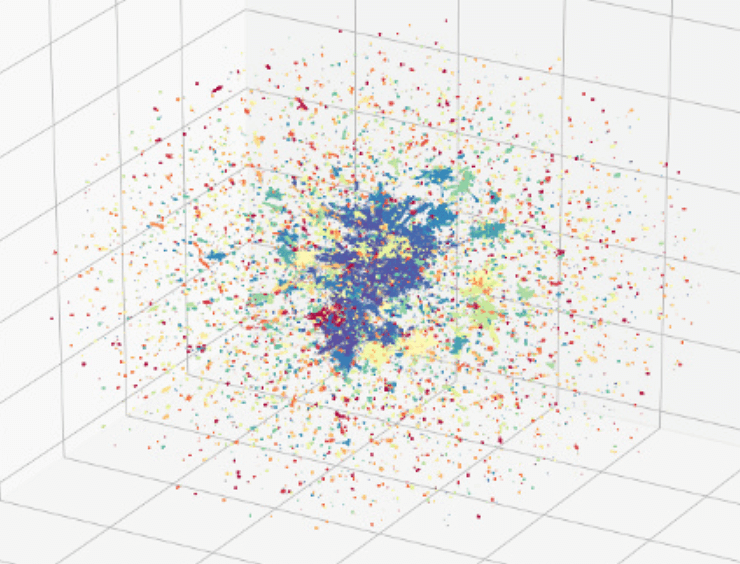
***Fig. 1: *Visualization of the 50 largest user clusters in a user-(user-content)-user map (n = 5,500,452)
Traditional approaches to network analysis are often limited to studying tens or hundreds of thousands of observations due to the computational complexity and memory demands of these algorithms and models. These limits are exacerbated when networks include heterogeneous/multi-modal nodes comprised of users, different types of relationships (e.g., following, followed-by, mentioned), and multiple forms of content users can share (e.g., hashtags, URLs, word token n-grams). Deep learning models for heterogeneous graphs, however, let us overcome these limits and efficiently scale our work at Graphika to tens of millions of nodes with hundreds of millions of edges (see Fig. 1).
Integrating graph embedding models for heterogeneous networks (metapath2vec) with language embedding models for documents and words (doc2vec) enables us to predict rare events and cluster together groups of users and content that share complex and potentially hidden or hard-to-reveal relationships. For example, work by Graphika Labs researcher Alexander Ruch (2019) shows that joining these methods together lets one predict potentially suicidal individuals (who post submissions to SuicideWatch; ~1% of the study’s sample) with over 90% accuracy and only 10% false-positive/-negative rates. Moreover, this method is robust to contexts in which individuals primarily engage with one set of communities and only rarely interact with communities discussing topics related to mental health or suicidality (see Fig. 2 and Fig. 3).
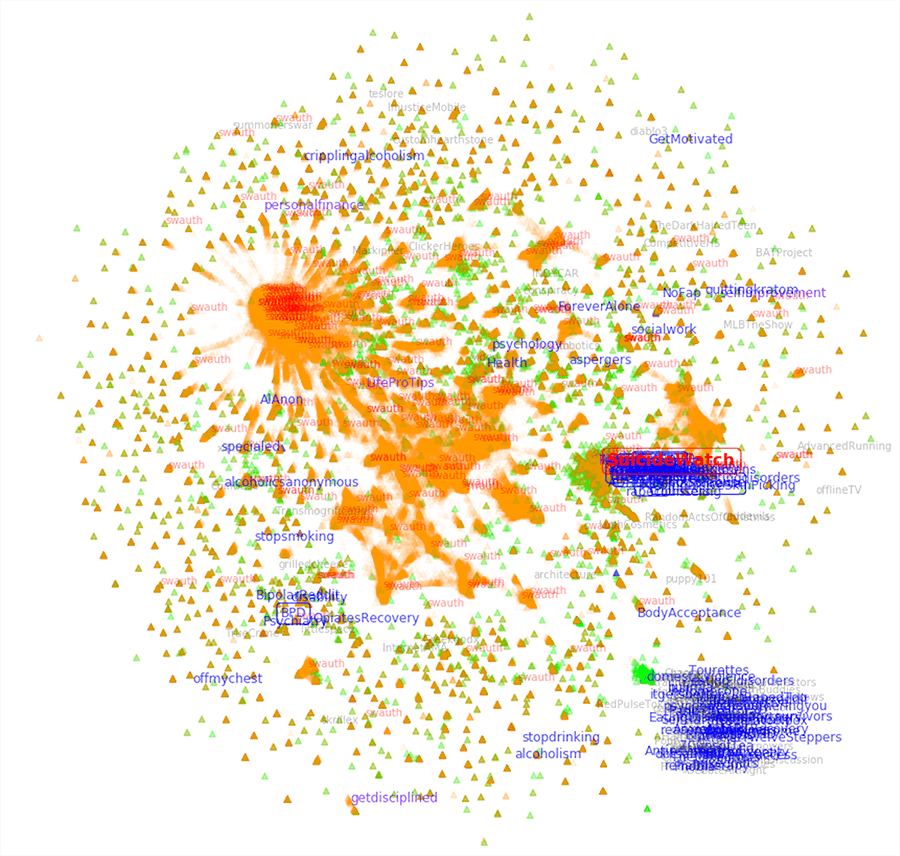
***Fig. 2: *Visualizations of subreddit-author node embeddings (n = 9,917,270, e = 45,299,669)
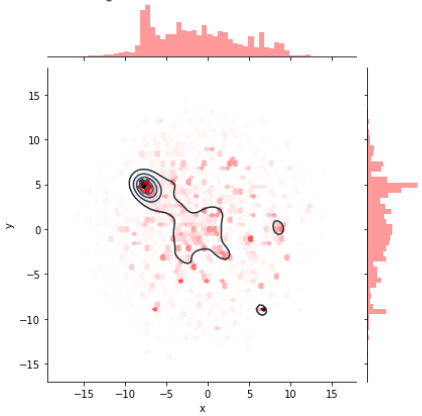
Fig. 3: Heatmap for predictions of authors who will post in SuicideWatch – compare to Fig 2
Applying hierarchical density-based spatial clustering of applications with noise to these data facilitate our ability to identify distinct groups of users and infer their relationships with similar groups of users. For example, Fig. 4 shows the deep graph embedding for focal users from our South by Southwest (SXSW) map. The map reveals large holes in between members of some clusters (e.g., a hollow core, clusters of periphery groups, and clusters that stretch out with each end closer to different clusters) as well as close similarities between others. For example, Fig 5 highlights the similarities between four different clusters: Irish and Australian artists are both periphery clusters; however, they are both somewhat close to each other (likely due to their cultural similarities to the UK) and they both reach toward UK producers (again, likely due to shared media cultures), who are near US public relations groups (likely due to international media relations). We’ve revealed similar patterns of relationships among artists, producers, venues, and media from Scandinavian, Latin, African, and other regions as well.
***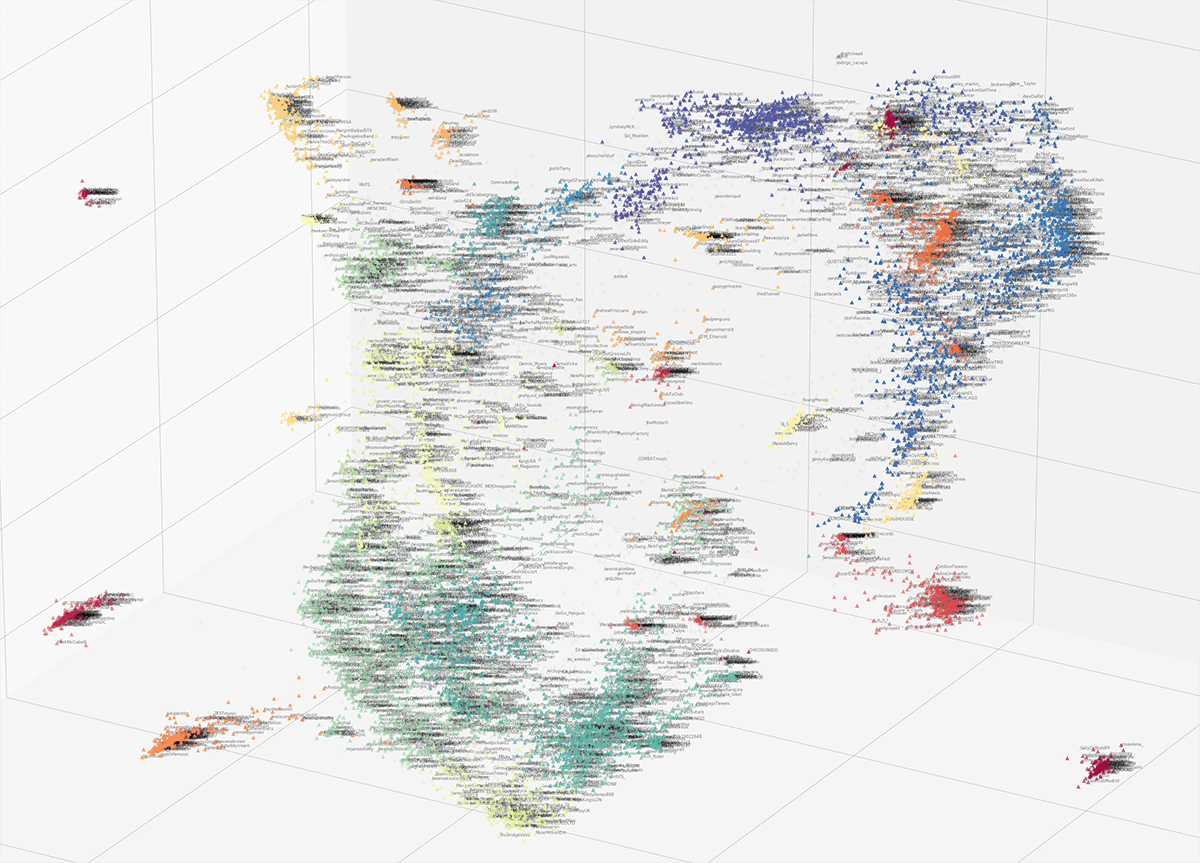 Fig. 4: *Clustered focal users from our South by Southwest map (n ≈ 15,000)
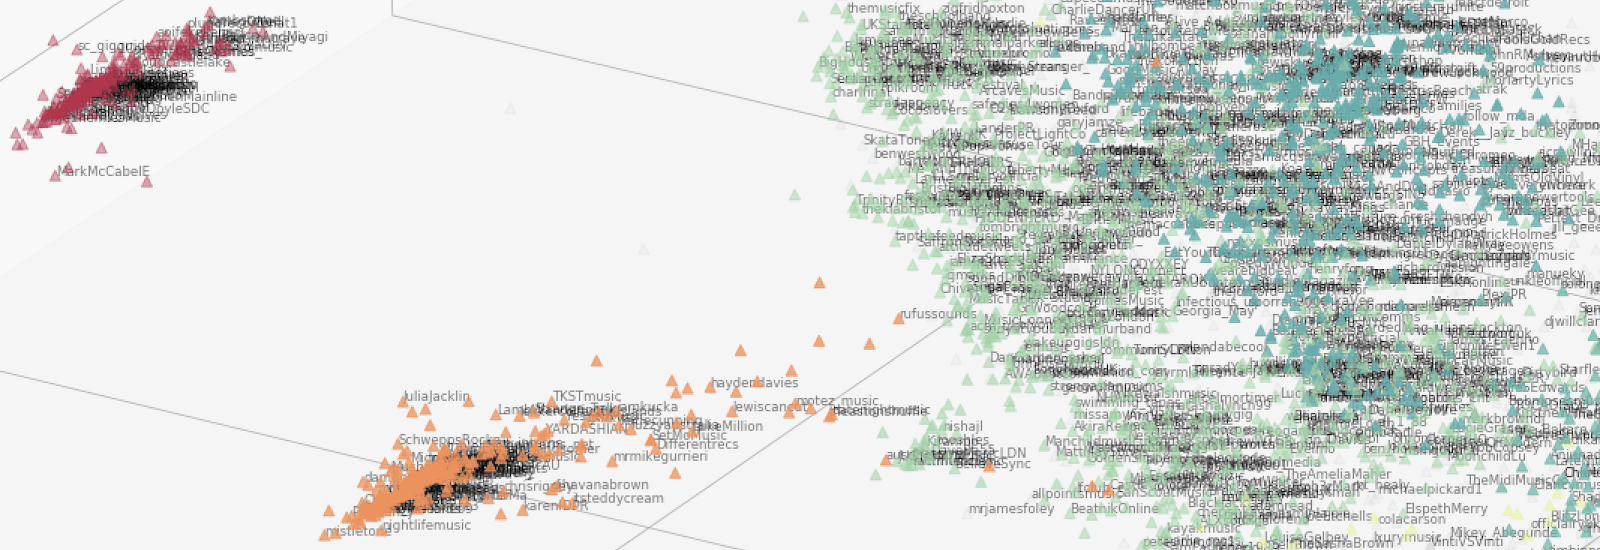 Fig. 5: Irish (red) and Australian (orange) artists, UK producers (green), US public relations groups (blue)